US Export Trends: Q2-2021 Figures
Exports during 2021-Q2 hit record high as they outpace pre-pandemic levels. Growing demand for American-made food and electronic parts
Pubblicato da Lorenzo Fontanelli. .
United States of America Macroeconomic analysis Importexport Global demand Global Economic Trends
Accedi con il tuo account per utilizzare le funzioni stampa migliorata (pretty print) e includi articolo (embed).
Non sei ancora registrato?
registrati!
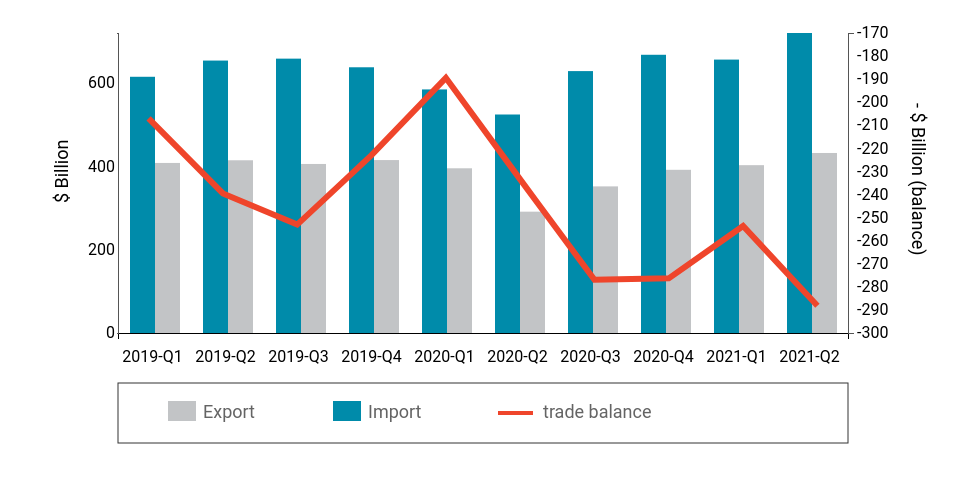
On July 2, the US Census Bureau has released May’s trade statistics, providing information on imports and exports of merchandise goods between the United States and its partners. According to ExportPlanning estimates, the total value of U.S. traded goods reached record highs in this year’s second quarter, with exports and imports amounting respectively to $432 and $721 billion. Data shows that US trade has bounced back to pre-pandemic levels: compared to 2019-Q2, shipments from the United States rose by 4.3%, whereas imports grew 10%. Increasing internal and external demand for American products have been supported by swift vaccination rollouts along with major government policy interventions, including significant fiscal stimulus measures.
Although exports are performing well, the record pace is being fueled by US purchases. This, of course, means that the trade deficit is running firmly into negative territory.
The graph below illustrates the evolution of the trade balance over the last two years. After a first-quarter modest fall - mainly due a drop in imports - it soared again to -$288 billion in 2021-Q2. Importantly, for the first time since 2011, trade imbalance surpassed $500 billion at mid-year.
US Trade Balance (2019-2021)
The contraction of demand for US products caused by the pandemic varied dramatically among industries. Not all of them have performed equally since the outbreak of the Covid-19 crisis. Therefore, the prospects for a quick and strong recovery differ across sectors. But which ones are leading the recovery and what does that tell us about the resilience of US exporters?
To answer this question, we should take a closer look at the export performance of main US industries - as shown in the following graph. The size of each ball is proportional to 2019 export values.
Source: Export Planning elaborations
While most of the industries were hit hard by Covid-19, their export figures across the half of this year indicate they are well on the road to full recovery. Compared to 2019-H1, exports of food - both packaged (+5.6%-B1) and unpackaged (+13.7%-E0), electronic parts (+10.2%-D1) and pharmaceuticals (+10.5%-E4) post significant growth rates. Also industrial raw materials (A2) and fine chemicals (B5) closed the gap on pre-pandemic levels, showing respectively +11% and +4.1% growth rates. Notwithstanding the fierce competition on global markets, exports of household products (E3) have increased +1.3% in 2021-H1.
Slightly negative results for ICT and service equipment (F1) and mechanical and optical components (D2), whose sales decreased -0.1% and -0.8% respectively. Finally, at the bottom-left, we find those industries who keep struggling to recover after the economic downturn: that is the case of vehicles (F3), vehicle components (D3) and fashion products (E2). However, the second quarter of 2021 shows a steady improvement compared with the values seen in the first quarter.
To identify the markets spearheading US export recovery across 2021-H1, we should keep track of the import performance of the main trade partners.
Apart from China, which records the highest growth rates in 2021-H1, the US maintains vibrant trade relations with Taiwan and Singapore (compared with 2019-H1, exports to these countries increased respectively by 14.8%, and 9.4%). Sales to Japan and Hong Kong were characterized by a moderate drop. In Europe, American exporters are selling the highest dollar worth of goods to Switzerland and Germany, whilst demand from other countries is still below its 2019 levels. In particular, French imports plummeted -22% with respect to 2019-H1. Among Latin American neighbors, exports to Chile rose by almost +6%.
Source: Export Planning elaborations
Conclusions
Data on 2021-Q2 tell us that global consumers are buying more U.S. exports as the pandemic comes under control and economies recover. This positive trend involves some industries more than others. Nevertheless, the rapid spread of new variants is bringing new uncertainties as to how the current positive outlook will actually materialize over the next few months. Monitoring international trade flows is thus crucial to ensure the best guidance on export opportunities.


