Conjuncture H1 2023: some cases of resilient markets in the world trade of Household Products
Against a backdrop of widespread trend declines in global sales of finished household products, there are cases of markets bucking the positive trend
Published by Marcello Antonioni. .
Home items Conjuncture Global demand Industries Export markets Uncertainty International marketing Foreign market analysis
Log in to use the pretty print function and embed function.
Aren't you signed up yet?
signup!
Data (pre-estimates) for the second quarter of 2023 on international trade in finished household products1 confirm the declining phase of world exports: measured at constant prices2, in fact, world exports of finished products for the home showed in the period April-June 2023 a tendential reduction of 3.8%.
Indeed, it is an attenuation of the yielding phase already recorded in the average of 2022 (-6.8% at constant prices) and in the first quarter of the current year (-7.9%). However, as of the mid-year pre-final balance, all the main sectors, with the only significant exception of home textiles, show a downward trend in world exports measured at constant prices.
In mid-2023, almost all the main sectors of finished products for the home show a downward trend, with the only exceptions of consumer electronics and, above all, home textiles
World Exports of Household Products
| Levels 2022 | % Y-o-Y changes at constant prices | ||||
| Sector | (Bn €) | 2022 | Q1-2023 | Q2-2023 | H1-2023 |
| Household Appliances | 196.9 | - 9.4 | -11.3 | - 8.5 | - 9.9 |
|---|---|---|---|---|---|
| Consumer Electronics | 196.3 | - 6.3 | - 2.1 | + 2.2 | + 0.0 |
| Furniture and Furnishings | 107.2 | - 8.4 | -13.4 | - 8.2 | -10.8 |
| Lighting Technology | 65.7 | -10.9 | - 9.5 | - 1.2 | - 5.2 |
| Home Textiles | 49.8 | - 8.1 | + 1.7 | + 1.6 | + 1.7 |
| Other household products | 194.1 | - 1.7 | - 9.5 | - 4.3 | - 6.7 |
| TOTAL | 810.0 | - 6.8 | - 7.9 | - 3.8 | - 5.8 |
Source: ExportPlanning-World Trade Datamart
Household Appliances
In the first half of 2023, world exports of household appliances3, measured at constant prices, recorded a trend decrease close to two percentage figures (-9.9%). It is the result of a second quarter of the year in reduction again (-8.5%), although less intense than the first quarter (-11.3%).
In a sectoral context in which about 55 percent of international markets showed a negative trend in world sales measured at constant prices, cases in a positive countertrend should be reported of Russia markets (+25% compared to the first half of 2022, measured at constant prices), Philippines (+26.2%), Brazil (+39.5%), India (+28.4%) and Saudi Arabia ( +14.8%).
Consumer Electronics
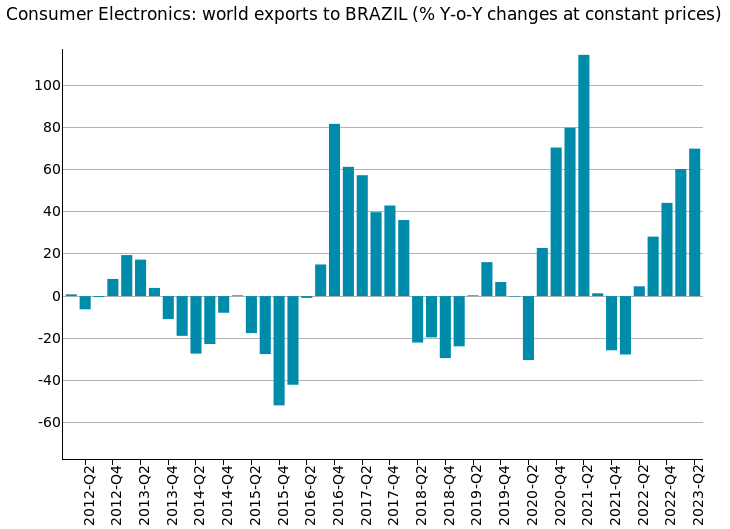
In the first six months of the year, world exports of consumer electronics4, measured at constant prices, recorded a stability compared to the corresponding period of 2022. It is the result of a second quarter of the year in which world sales of the sector have recovered a path of growth (+2.2% at constant prices ), after the sagging phase of the 2022 average (-6.3%) and the first quarter of 2023 (-2.1%).
In a sectoral context of uncertainty, however, in which about 48 percent of international markets expressed a negative trend in world sales measured at constant prices, the cases in significant countertrend of the Netherlands markets should be noted (+24.4% compared to the first half of 2022, in the measurement at constant prices), Russia (+124%), Brazil (+65.6%), Poland (+25%) and < b>India (+29.9%).
In particular, in the case of the Brazilian market (see the graph below), there is evidence of an expansion phase already underway some quarters. The fastest growing exporting country on this market is once again China, which in the first half of 2023 achieved a trend increase of 78 percentage points in the measurement at constant prices.
Furniture and Furnishings
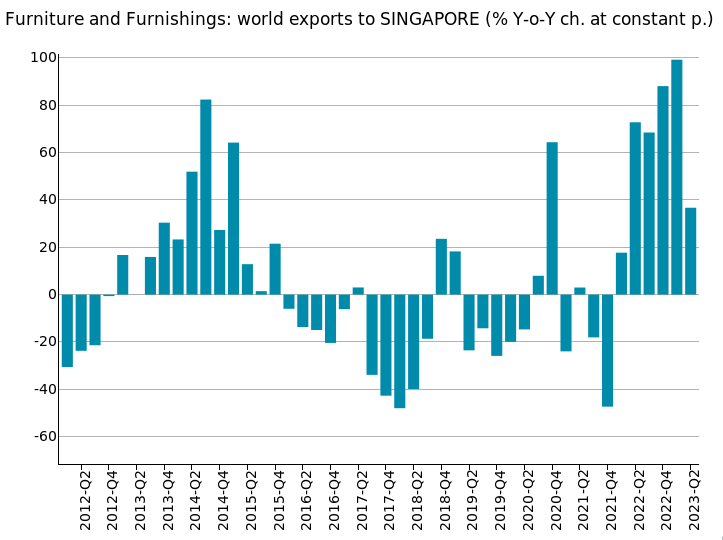
In the first half of 2023, world exports of furniture and furnishings5, measured at constant prices, showed a trend decline of almost 11 percentage points. This decline is the result of a second quarter of the year in which world sales of the sector showed a tendential decline of 8.5 percentage points (constant prices), after the sagging phase of the 2022 average (-8.4%) and the significant sign " less" than the first quarter of 2023 (-13.4%).
In a sectoral context in which approximately 52 percent of international markets showed a negative trend in world sales measured at constant prices , the cases in significant countertrend of the Singapore markets should be noted (+60% compared to the first half of 2022, when measured at constant prices), Saudi Arabia (+25.8%), Philippines (+33.2%), Thailand (+36.3%) and Vietnam (+35.4%).
In particular, in the case of Singapore (see the graph below), there is evidence of an expansion phase already underway for some quarters. The fastest growing exporting country on this market is, once again, China, which in the first half of 2023 achieved a trend increase of over 85 percentage points in the measurement at constant prices.
Lighting Technology
In the first half of 2023, world exports of lighting technology6, measured at constant prices, marked a reduction trend of more than 5 percentage points. This decline is the result of a significant contraction in the first quarter of the year (-9.5% at constant prices), which was followed by a less negative second quarter, but still with a slight trend decline (-1.2%). This follows a 2022 in which worldwide sales of the sector were reduced by about 11 percentage points (constant prices).
In a sectoral context in which about half of the international markets showed a negative trend in world sales measured at constant prices, reported the cases in significant countertrend of the markets of Singapore (+156% compared to the first half of 2022, measured at constant prices), Vietnam (+51.7%), Malaysia (+ 42.5%), Kazakhstan (+183%) and Saudi Arabia (+29.8%).
In particular, in the case of the Vietnamese market (see the graph below), there is evidence of an expansive phase already underway some quarters. The fastest growing exporting country on this market is, once again, China, which in the first half of 2023 achieved a trend increase of over 54 percentage points in the measurement at constant prices.

Home Textiles
In the first six months of the year, world exports of home textiles7, measured at constant prices, recorded a growth (+1.7%) compared to the corresponding period of 2022. It is the result of the first two quarters in which world sales in the sector recovered a path of moderate growth, after the sagging phase of the 2022 average (-8.1%).
In a sectoral context of uncertainty, however, in which about 53 percent of international markets expressed a negative trend in world sales measured at constant prices, the cases in significant countertrend of the United States markets should be noted (+8.7% compared to the first half of 2022, in the measurement at constant prices), Singapore (+155%), Vietnam (+49.8%), Hong Kong (+64.3%) and Russia (+43.4%).
In particular, in the case of the US market (see the graph below), there is a phase of - still moderate - recovery, after the negative phase experienced in 2022. The exporting country with the fastest growth on this market is, once again, China, which in the first half of 2023 recorded a trend increase of 20 percentage points in measurement at constant prices. Other competitors on the US market with a growth trend in the first half of the year are Mexico (+11.6% at constant prices) and France (+48.2 percent).

Other household products
Among the other household products, in the first six months of the year we note the greatest penalties for world exports of knives and cutlery8 (-18 % compared to the corresponding period of 2022, at constant prices) and pots and pans9 (-10.8%), against less negative dynamics for glasses and tableware10 (-3.9%).
In particular, in the knives and cutlery sector, 58 percent of world markets showed a downward trend (at constant prices) in the first half of the year, but with some markets significantly bucking the trend: above all, Singapore, Kyrgyzstan, Vietnam, Egypt and Turkey.
In the pots and pans sector, on the other hand, 53 percent of world markets recorded a downward trend (at constant prices) in the first half of the year, but with some markets significantly bucking the trend: above all, Singapore, Saudi Arabia, Vietnam, India and Russia.
Finally, in the glasses and tableware sector, 51 percent of the world markets recorded a downward trend (at constant prices) in the first half of the year, but with some markets significantly bucking the trend: on all the Vietnamese market, but also Singapore, Saudi Arabia, Philippines and Russia.
Conclusions
International trade data for the first half of 2023 confirmed the declining phase of world sales of finished products for the home, after a 2022 already negative (at least in the measurement at constant prices).
Most sectors of the home supply chain showed negative trends in the first part of the current year, with a (albeit moderate) prevalence of markets in negative territory.
However, we note the presence, in each of the sectors examined, of a no small group of particularly resilient markets, which in the first semester of the year showed positive dynamics in sales from the world (and in particular from China).
The need for exporting companies to monitor
the evolution of demand in the markets of interest
for their specific business area
For exporting companies in the home supply chain (but not only) it therefore appears strategic to be able to identify the most resilient international markets for their specific business area, on which to (re-)orient own marketing and business development actions.
With the aim of allowing constant monitoring of the reference foreign markets, ExportPlanning provides Market Insights, a new series of information services aimed at specifically supporting the market intelligence and budgeting processes of exporting companies.
1) For a description of the sectors included therein, see the related industry profile.
2) The measure Quantities at constant prices (Q). This measure includes a deflation operation, in which the historical series of monetary values (V) has been transformed into an analogous series of values expressed at constant prices, with a reference to a given year, known as the base year. For a description of the methodology applied, please refer to Methodological Note on the World Trade Datamart.
3) For a description of the products included therein, see the relative sector profile.
4) For a description of the products included therein, see the relative sector profile.
5) For a description of the products included therein, see the relative sector profile.
6) For a description of the products included therein, see the relative sector profile.
7) For a description of the products included therein, see the relative sector profile.
8) For a description of the products included therein, see the relative sector profile.
9) For a description of the products included therein, see the relative sector profile.
10) For a description of the products included therein, see the relative sector profile.


