The first effects of sanctions on EU-Russia trade flows
EU exports to Russia plummet in March, while imports continue to grow, driven by raw materials.
Published by Simone Zambelli. .
Conjuncture Foreign markets Uncertainty Eurozone Global economic trends
Log in to use the pretty print function and embed function.
Aren't you signed up yet?
signup!
The latest update of the European Union's trade data, released by Eurostat on May 16, offers a close look at the first economic consequences that the EU's sanctions against Russia have brought.
In March 2022, European exports to the Kremlin's market plummeted dramatically, from 8 billion euros in March 2021 to 3.8 in March 2022, a drop of more than 53%.
In stark contrast, however, was the dynamic shown by the Union's imports from Russia, which instead grew by +111% compared to the corresponding month of 2021.
Fig. 1 – Total EU-Russia imports and exports
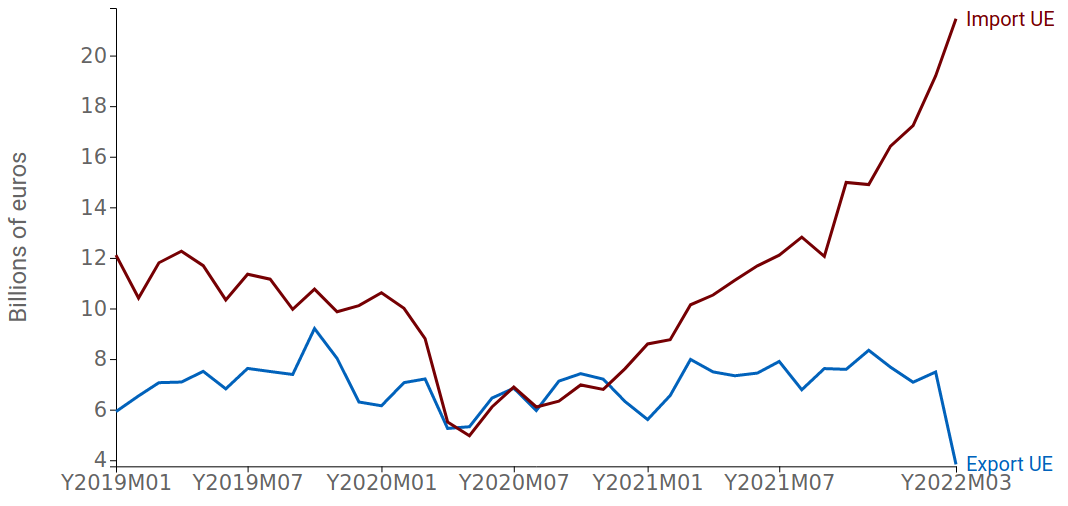
Source: ExportPlanning.
In fact, EU imports from Russia have risen from 10 billion in March 2021 to a record 21 billion in March 2022, also strongly supported by strong gas price increases. In fact, as is well known, a large part of European imports from Russia is composed of raw materials, with a princely role played by gas.
Fig. 2 – EU Imports from Russia
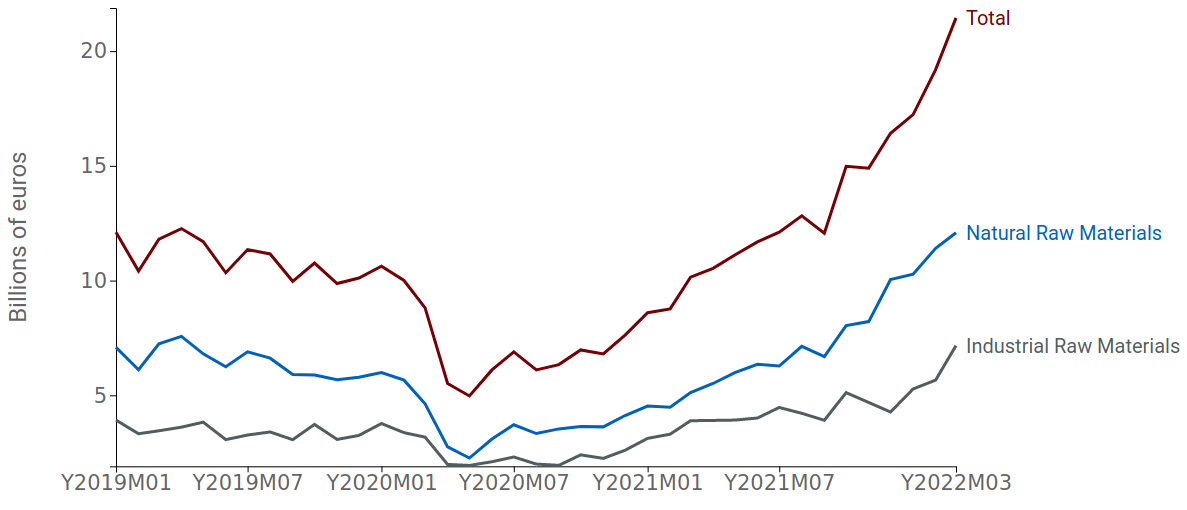
Source: ExportPlanning.
The result can be attributed to the fact that the Kremlin's gas supplies are still active to the majority of European countries, and the agreements that the Union is forging with other partners, to try to replace Russian gas supplies with third parties, are not yet active, nor able to compensate for Moscow's role in the Old Continent's energy supply. This is also evidenced by the fact that European sanctions have not affected major Russian banks engaged in energy transactions.
Drastic deterioration in the EU-Russia trade balance. Which countries and sectors have shown the most significant declines in exports?
Sectoral and country export analysis
EU export trends at sectoral level confirm what has been seen previously, namely an almost across-the-board collapse, with the only exception of health care products.
The graph below shows the rates of change between March 2022 and March 2021 of the main EU export sectors to Russia, sorted decreasingly by export value in 2021.
Fig. 3 – Trend rate of change of EU exports to Russia
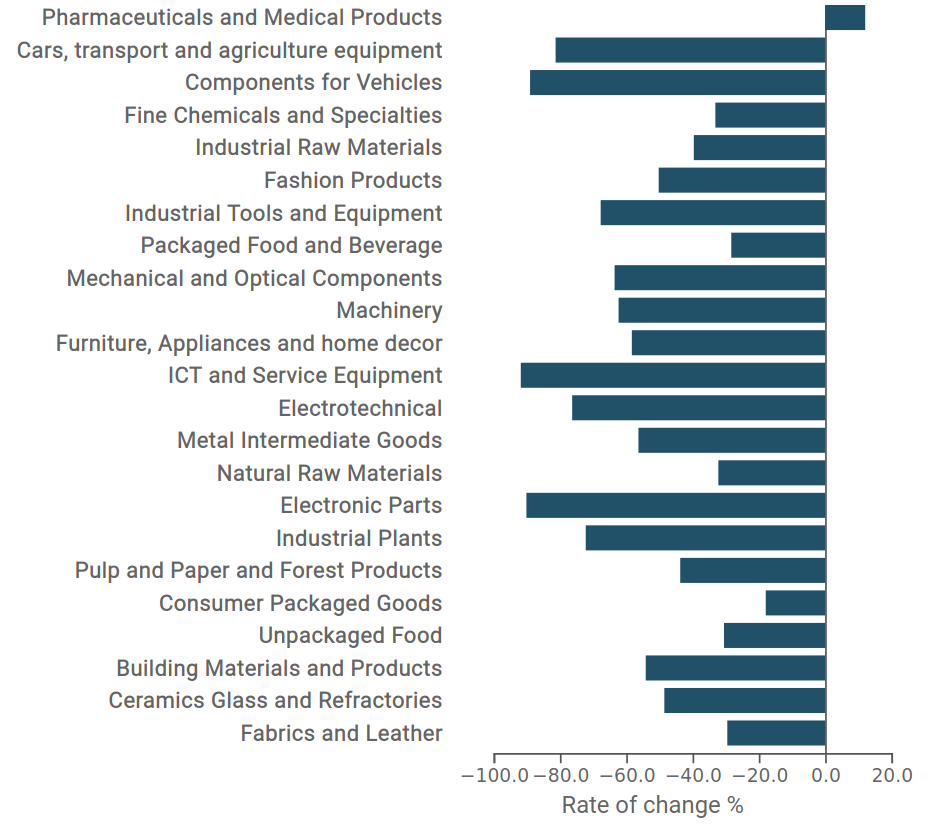
Source: ExportPlanning.
Although some sectoral heterogeneity is evident, the drop is clearly visible and particularly significant for the entire supply chain of transportation equipment, ICT tools and equipment, and electronic components.
Shifting our attention to the performance of individual Member States, again we can observe a sharp decline common to all major economies.
As in Fig.2, the graph shown shows the trend change between March 2022 and March 2021, with a decreasing ordering of countries by export value to Russia (2021).
Fig. 4 - Trend rate of change in exports to Russia
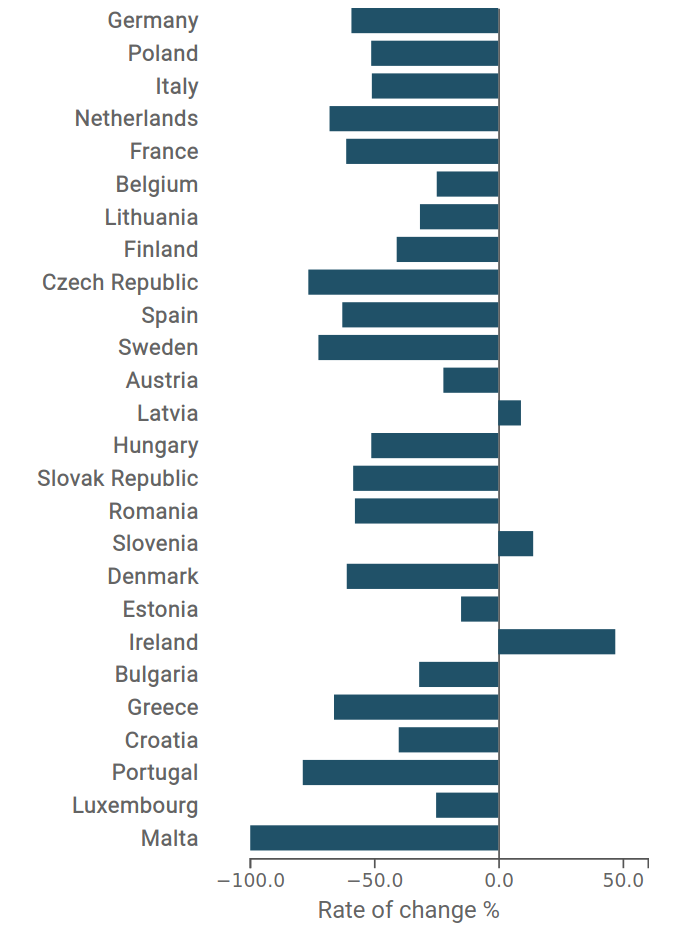
Source: ExportPlanning.
With EU exports falling by 50%, experiencing the most significant decline we find the Netherlands (-67%), France (-61%) and Germany (-60%), compared with the Polish (-51%) and Italian(-50%), which are in line with the European average.
Some Eastern European countries, along with Austria and Belgium and the Baltic Republics, register the smallest and, in the case of Latvia, Slovenia and Ireland, even positive changes. In particular, the latter is distinguished by a particularly positive trend (+47%) driven by the strength of the domestic pharmaceutical industry.
Conclusions
The measures taken by the European Union toward Moscow over the invasion of Ukraine have immediately had real effects on European exports, in the face of an overall worsening of the EU-Russia trade balance due to the robust increase in gas imports.
The closure of the Russian market therefore forces European firms to reposition themselves in other markets that can compensate for the losses incurred, especially for those goods that are particularly valued by Moscow.


